

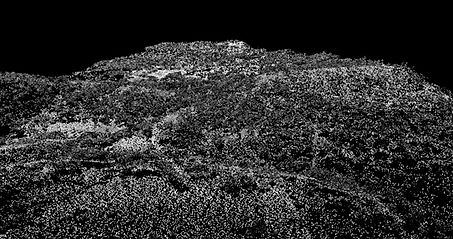
Point Cloud
Classified Point Cloud
Point clouds are a collection of points that represent a 3D shape or feature. Each point has its own set of X, Y, and Z coordinates.
The LiDAR system requires many components to record all data, such as a GPS, so that each point has accurate position data attached.
The lidar point cloud is so precise that we can discriminate the different elements to classify terrain, vegetation, buildings, and power lines:


Color by Elevation - Applies a color spread to the range of elevations found in the Lidar data and filter them to create a color profile.
Color by Intensity - Color lidar points from black to white by the intensity of the return pulse, measuring the strength of it, the number of returns will be determined by the composition of the surface object reflecting the return.

Color by Flight Line and Intensity - View projected data by flight line + overlapping intensity.
Color by Classification - Colors Lidar points by the ASPRS defined classification values, the coloring shows the data with their different classifications (Ground, Vegetation, Buildings, and so on).


Color by RGB - LIDAR points can be colored by Red, Green, Blue (RGB) values extracted from an orthophoto for a more realistic representation of the terrain
Digital Elevation Model (DEM)
A topographic model of the bare earth - terrain relief. The data files contain the spatial elevation data of the terrain in a digital format.


A digital elevation model (DEM) can be described as a three-dimensional representation of a terrain surface consisting of X, Y, Z coordinates stored in digital form, excluding any other non-terrain feature.
Using elevation models, features such as scarps, steep slope units, lobed accumulation zones, and uneven topography can be enhanced to allow delineation and classification of landslides.

Digital Surface Model (DSM)
A digital surface model (DSM) is a specialized database that represents the relief of a surface between known elevation points.


From the obtained LIDAR data, we can generate the digital elevation model, which can be symbolized by a color ramp, special effects, such as the slope, can be used to simulate the relief.
The digital surface model gets the z coordinates of the value along with x and y. The elevation values are specifically distinguished as; roads, buildings, bridges, vegetation, water, etc.

Contours
Lines connecting points of equal elevation are drawn on a topographic map to quantify elevation at any point on the map.


When the contour lines are close together, it means that the topography is very steep, when the lines are further apart, it means that the terrain slopes more smoothly.
A topographic map, for example, reveals the relief of an area by means of contour lines that represent elevation values; Each of these lines passes through points of the same elevation.

Planimetry
Planimetric information is generally required for large-scale applications: urban mapping, facilities management, military reconnaissance, and general landscape information.


A map showing the x, y positions of features on the Earth's surface showing geographic objects, natural and cultural physical features, and features without topographic features such as roads, buildings, and water bodies that are visible and identifiable in aerial photographs , but that can be compiled into map features through photogrammetric or topographic survey procedures.
Orthophotography
Orthophotos are orthogonal aerial photographs that are free of tilt and camera distortions and are also free of relief distortions.


Our systems execute aerial LIDAR topography at the same time as rectified orthophotography with direct georeferences. The data is digitally corrected to represent an orthogonal projection with no perspective flaws, allowing us to accurately generate plans and maps, rather than an aerial photograph. Aerial photographs will always present the deformations caused by the perspective of the camera and the height or speed at which the camera is moving.
Normalized Difference Vegetation Index (NDVI)
The NDVI for its acronym, quantifies the vegetation by measuring the difference between the near infrared (which strongly reflects the vegetation) and the red light (which absorbs the vegetation).


The Normalized Difference Vegetation Index (NDVI) uses the NIR and red channels in its formula
NDVI = (NIR - RED) / (NIR + RED)
The result of this generates a value between -1 and +1. If you have low reflectance (or low values) in the red channel and high reflectance in the NIR channel, this will produce a high NDVI value and vice versa.
Healthy vegetation (chlorophyll) reflects more near infrared (NIR) and green light compared to other wavelengths. But it absorbs more red and blue light.


That is why our eyes see vegetation as the color green. If you could see near infrared, it would be strong on vegetation too.
Seagrass Classification
Seagrasses are submerged ecosystems, in shallow estuaries. They have flowers, long and narrow leaves, green most of the time. They are very similar to wheat fields.


During the interpretation of RGB photos in the visible spectrum, some elements / characteristics / materials can be difficult to differentiate, but this does not happen when we go to the INFRARED SPECTRUM.
We can generate a precise classification, based on the spectral signature and the physical and visual inspection, as well as the ability to calculate the classification area, since we can obtain the type of material for each pixel.
